A new model visualizes protein molecular landscapes and identifies functional—and dysfunctional—structures.
by Amber Garcha
A computer model developed by Nasrin Akhter, a Ph.D. student studying at the George Mason University Department of Computer Science, utilizes concepts of machine-leaning and computational geometry to analyze high-dimensional data, transform it into a visual model of a protein landscape, and recognize key functional structures in the protein.
A protein is a long chain of amino acid molecules that is folded to create different three-dimensional shapes and structures. Proteins do most of the work in our cells, such as acting as enzymes to speed up chemical reactions or transmitting signals to different parts of the cell.
“A protein molecule assumes a specific three-dimensional structure [through the folding of amino acid chains], which can be called a functional structure, to do this work in our cells,” Akhter explains.
Protein structural landscapes are high dimensional spaces that are made up of these protein structures. Akhter describes her research objectives, stating “In my research, by mining a protein landscape, I try to answer where in this landscape does the protein structure reside? How can I automatically recognize those functional structures by mining functional landscapes?”
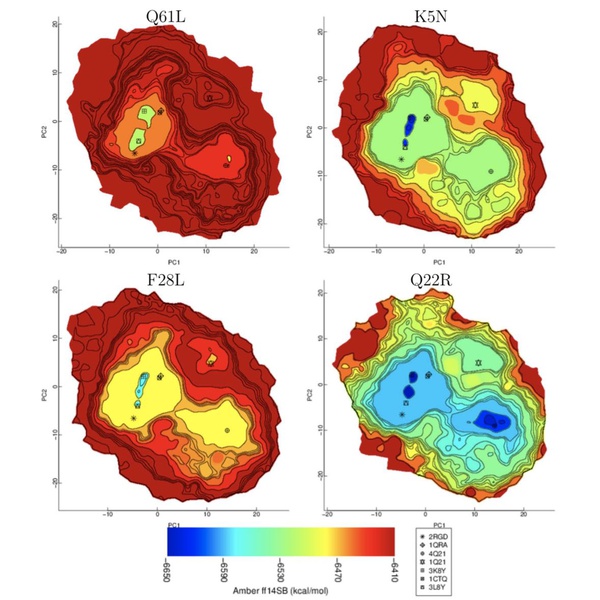
Identifying the location of a protein’s functional structure within the landscape is essential to determining which are biologically-active, and the visualization of the whole landscape would give valuable insight on any changes in structure for mutated and diseased proteins. However, the structural landscapes are very complex, with countless data points of the proteins’ energy levels. The computer model developed by Akhter at GMU converts the massive amounts of spatial data into a visual model representing energy levels throughout the landscape, as well as recognize its functional structures.
In order to create the visual model, many protein structures are sampled to create a high dimensional dataset. The top two principle components of this data are extracted, which provide the main structure of all the data. The shape of the distribution, called the alpha convex hull, is then calculated using computational geometry methods, and a grid is placed over the shape to define specific regions of the data.
Machine learning methods such as kernel regression are used to estimate the energy values in different parts of the protein landscape and place them correspondingly in the alpha convex hull grid. Kernel regression determines non-linear relations between variables by using vector calculations in high-dimensional spaces, such as this molecular landscape, and separates and organizes the data accordingly.
Finally, the landscape is reconstructed into a visual model by using lower level sets and hierarchal algorithms, other machine learning methods that cluster the data points together and “layer” them accordingly. Once the protein landscape has been reconstructed, it can be analyzed to learn about how landscapes are affected by diseases and mutations.
Identifying the biologically-active functional structures is an entirely different process. The decoys, which are protein structures generated by a predictive software, are arranged into a nearest neighbor graph (NNGraph), which compares distances between data points to create a connected structure. The local minimums of the graph are used to organize it into components called basins. These basins are sorted based on their size and energy, and their characteristics are used to identify the functional structures.
Akhter’s computer model that both visualizes protein landscape structure and energy level as well as identifies the biologically-active structures within a landscape could have enormous implications for future study of protein landscapes and its impact on protein function/dysfunction.
Additionally, Akhter notes “The methods that I designed using my research are general; that is, they can not only be applied to molecular structure data, but also to any high dimensional spatial data.” Thus, her process of computing and organizing data to create models and identifying key components can be used for any type of complex, high-dimensional data, not solely those concerning protein landscapes.